Enhancing Business Success Through Customer Retention
As the saying goes, "customer acquisition might be the game, but customer retention is the name of the game." Customer retention is a significant metric that all businesses should pay attention to if they want to succeed. Acquiring new customers can be relatively costly and challenging, while retaining existing ones is essential for reducing costs, increasing revenues, and enhancing customer loyalty. One powerful tool for customer retention analysis is Tableau, a data visualization and business intelligence software that helps businesses make data-driven decisions. In this article, we will explore how businesses can create a customer retention dashboard in Tableau for improved results.
The Importance of Customer Retention in Business
Customer retention is critical for any business due to its cost-effectiveness. Acquiring new customers is up to five times more expensive than retaining existing ones, according to a study by Harvard Business Review. Additionally, the probability of selling to an existing customer is significantly higher than to a new prospect. Higher retention rates lead to increased revenues, stronger customer loyalty, and enhanced brand reputation. Businesses that prioritize customer retention can gain a competitive advantage, as satisfied customers are more likely to recommend the business to others, reducing the need for extensive marketing efforts.
Furthermore, loyal customers tend to be less price-sensitive and more forgiving of occasional mistakes, allowing businesses to maintain a steady revenue stream even in competitive markets. Investing in customer retention strategies is therefore a smart business decision that can yield long-term benefits.
Understanding Customer Behavior to Improve Retention
Analyzing Customer Churn
Before creating a retention dashboard, it is essential to understand why customers leave a business. Identifying churned customers and analyzing their interactions can provide valuable insights into the touchpoints where customers disengage. By examining the customer journey and sales funnel, businesses can pinpoint specific areas for improvement.
Identifying Factors of Customer Loyalty
Understanding what makes customers loyal involves analyzing feedback, lifetime value, and purchase behavior. Tools like surveys and feedback forms can help gather qualitative data, while transactional data can offer quantitative insights. This comprehensive understanding enables businesses to create data-driven retention strategies that enhance loyalty and reduce churn.
Customer Segmentation
Segmenting customers based on demographics, behavior, or preferences allows businesses to tailor their marketing and retention strategies to each group's specific needs. For instance, identifying a segment that is more likely to churn due to low engagement enables targeted campaigns to increase their interaction and satisfaction.
Leveraging Tableau for Customer Retention Analysis
Benefits of Using Tableau
Tableau is renowned for its user-friendly interface, offering interactive dashboards, drag-and-drop functionality, and real-time data visualization. Its ability to integrate with various data sources through numerous connectors makes it an ideal tool for comprehensive customer retention analysis.
With Tableau, businesses can handle large datasets and perform complex calculations to identify patterns and trends in customer behavior. This capability allows for more informed marketing strategies and improved customer satisfaction.
Building a Data-Driven Retention Strategy
Creating a data-driven customer retention strategy with Tableau involves collecting customer data from multiple touchpoints such as email campaigns, social media, and website analytics. Organizing this data and visualizing it through Tableau's tools helps in identifying key trends like customer lifetime value and churn rates. These insights inform actionable plans aimed at improving retention, such as personalized marketing campaigns and loyalty programs.
Designing Effective Customer Retention Dashboards in Tableau
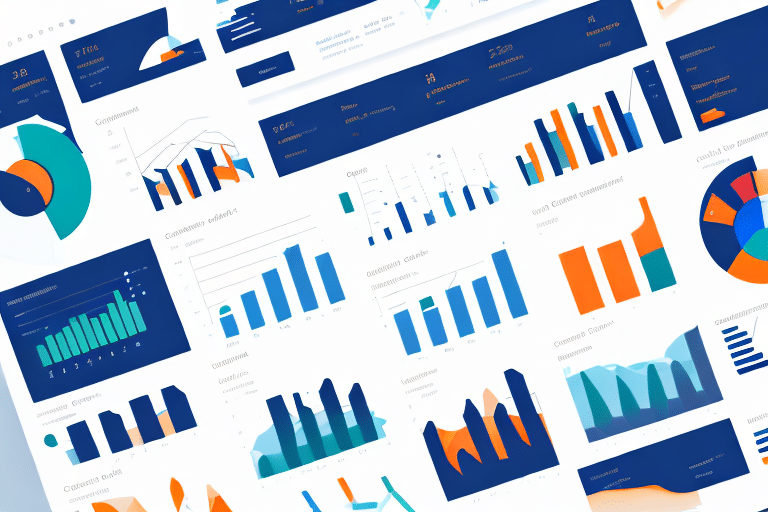
An effective customer retention dashboard starts with identifying key performance indicators (KPIs) that align with the business's retention strategy. Common KPIs include churn rate, customer lifetime value, and customer satisfaction scores. Using Tableau's drag-and-drop functionality, businesses can design dashboards that provide a clear overview of these metrics, making it easier to identify trends and patterns.
Interactive elements within the dashboard allow stakeholders to delve deeper into the data, uncovering more nuanced insights. Ensuring that the dashboard is user-friendly and accessible to all relevant parties is crucial for fostering a data-driven culture within the organization.
Measuring and Tracking Key Performance Indicators with Tableau
Tableau enables businesses to track essential KPIs effectively. By monitoring metrics such as customer lifetime value, churn rate, net promoter score, and customer satisfaction, businesses can gain a comprehensive understanding of their retention performance. This ongoing tracking allows for timely adjustments to retention strategies, ensuring they remain effective and aligned with business objectives.
For example, if the churn rate begins to rise, businesses can use Tableau to analyze the underlying causes and implement corrective measures promptly, thereby minimizing potential revenue losses.
Implementing Insights from Tableau Dashboards
Actionable Plans Based on Data Insights
Once trends and patterns are identified through Tableau dashboards, businesses should develop actionable plans to address retention challenges. This might include personalized marketing efforts, enhanced customer service, or the introduction of loyalty programs designed to increase customer satisfaction and loyalty.
Measuring the Effectiveness of Retention Strategies
Tableau allows businesses to measure the impact of their retention strategies over time by tracking key metrics. This ongoing measurement ensures that strategies are effective and provides the opportunity to make necessary adjustments to optimize retention efforts continually.
The Future of Customer Retention Analysis with Advanced Analytics
Advanced analytics tools like Tableau are transforming customer retention analysis by incorporating machine learning and artificial intelligence capabilities. These technologies provide predictive analytics, allowing businesses to anticipate customer behavior and proactively address retention challenges.
The future of customer retention lies in leveraging these advanced tools to gain deeper insights into customer behavior, enabling more precise and effective retention strategies. As businesses continue to adopt these technologies, the ability to maintain high retention rates and foster long-term customer loyalty will become increasingly attainable.
Creating a customer retention dashboard in Tableau empowers businesses to make informed, data-driven decisions that enhance retention rates. By identifying critical KPIs, designing user-friendly dashboards, and implementing insights-based strategies, businesses can significantly improve customer loyalty and drive sustained growth.


